[ Updated Aug 3, 2016 ]
11-MINUTE READ · By Paul Koks on August 03 2016
In the last 10 years I have audited dozens, or probably even hundreds of Google Analytics accounts. Most setups are far from collecting meaningful and reliable data.
This post will equip you with tools and tips to improve your setup in the next few days. I will discuss 10 different items that are important to get right from the start.
1. Account structure and raw data view
Google Analytics allows you to set up one account with multiple properties and reporting views. Read this support article if you are not completely familiar with it yet.
There is one golden rule here, always keep one data view without filters and/or other modifications. This is called a raw data view.
Filters and their effect on your historical data cannot be undone. Start out with segments and move to filters once you get more experienced with segmentation in general.
Every company should set up a few data views including raw data view and one view with IP address filters. This reporting view guide will tell you all you need about setting up different views for your business.
2. Bot filtering
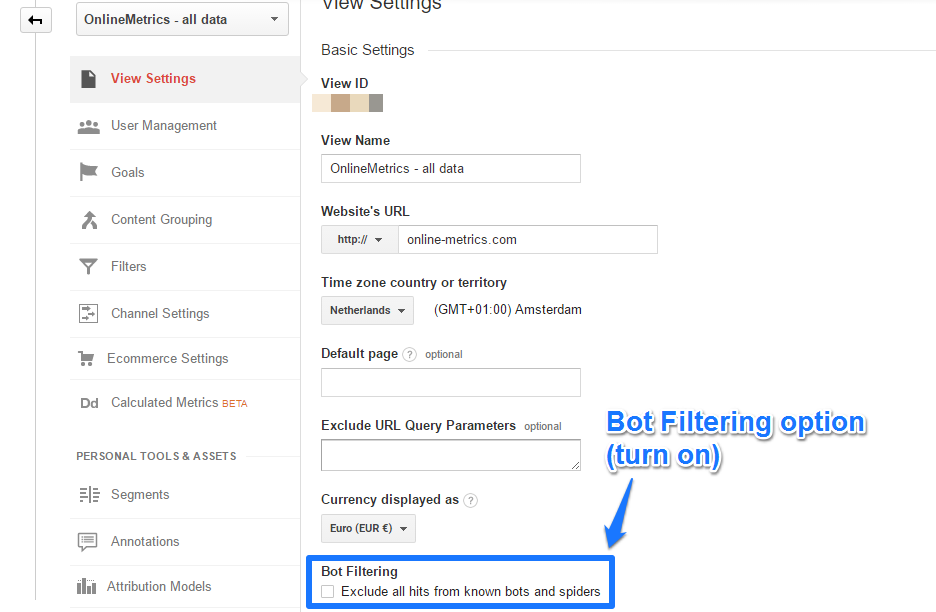
In all your reporting views – except your raw data view – you need to turn on the bot filter setting.
It can be easily located in each of your reporting views under the “view settings” tab:
In addition, make sure to set up a hostname filter on your domain(s) as well.
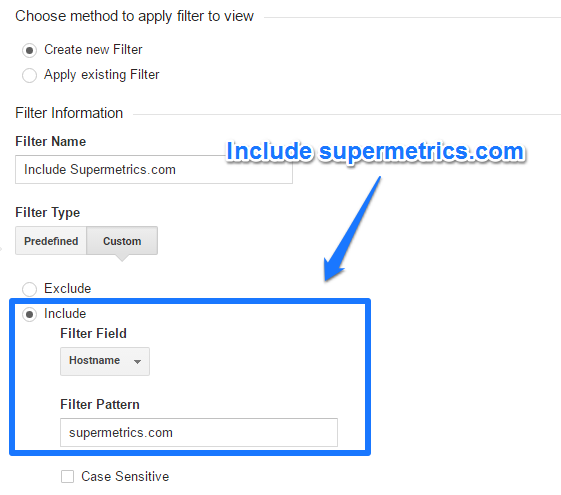
This will prevent you from irrelevant/unreal traffic showing up in your account.
Google Analytics is doing a lot to ensure that the least amount of spam traffic reaches your account. At a minimum I recommend to take the above steps to enhance the quality of your traffic from your end.
3. Goals
The very important and specific actions you want your website visitors to take on your website are called conversions or goals.
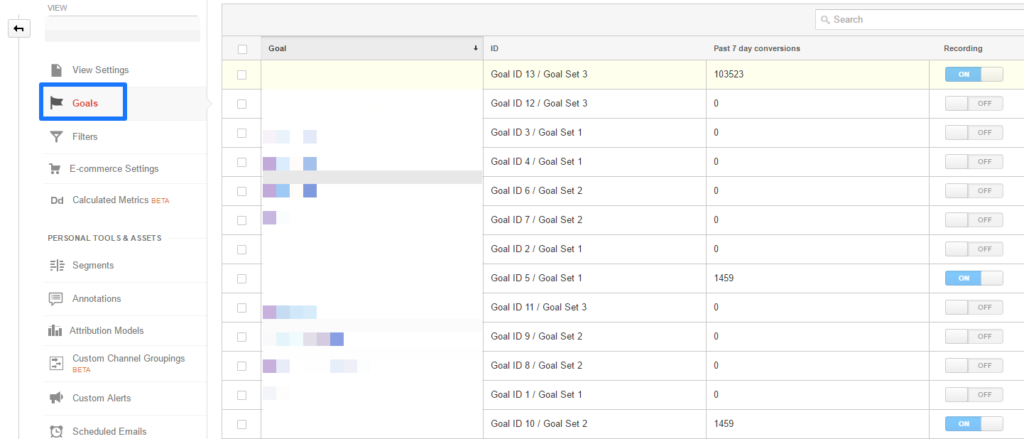
You can find your goals both in the reporting and admin interface.
Goals in admin interface
 I
I
In the example above, many goals are not recording (turned off) and might have been in use in the past. Two goals record the same number of conversions and in total there are three goals set up in this reporting view.
Step 1: define your most important goal(s) on your website: macro goal(s).
Step 2: define your supporting goals on your website: micro goals.
Step 3: decide upon which goals to implement in Google Analytics. Please refrain from implementing goals with very high conversion rates (“easy” conversions) in your main reporting view. This will make your overall conversion rate metric useless.
Step 4: implement and test your goals in Google Analytics.
Setting up goals is one of the most important activities you can do in Google Analytics. Well-defined goals will help you find out what works on your website and what doesn’t work. You can cross-segment your goals to many different dimensions in the reporting interface. Another trick is to use the Google Analytics API and export your conversion data to an external tool for further analysis.
4. Goal value
Don’t set up goals without a goal value. You should always apply a goal value to your goal; the only exception is e-commerce transactions. These transactions have already a value attached via the revenue metric. 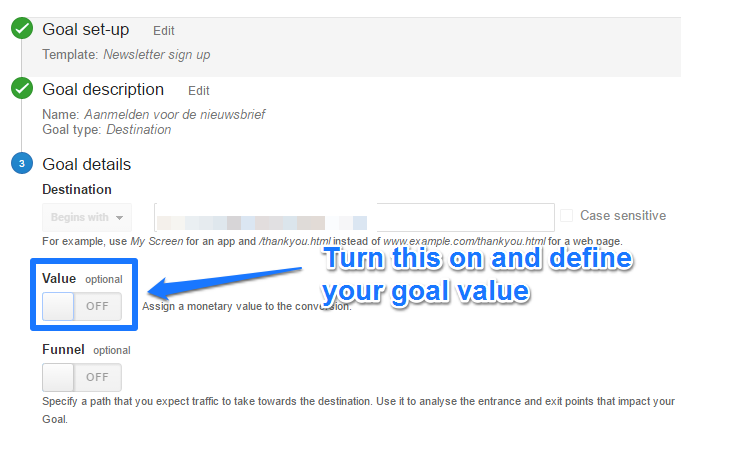 Here a few guidelines:
- Start with applying a value to your most important goal (this is most often the easiest to do).
- Apply other values (that you can make an estimation for) for the other, minor goals.
- Use relative goal values for the goals you are not sure about.
At the end it is all about getting an estimation of how your website is performing in different channels, on different landing pages etc. and compared to your costs.
Setting up goal values will unlock a few different powerful metrics of which page value is one of them!
Goal values help you to analyze and optimize your website efforts. In addition monetary values are much easier to discuss internally than absolute numbers. Think about the difference between saying: “In total we have 3.000 macro and 8.000 micro conversions or we have generated Ç 250.000 of value for our organization (estimation)”. What would your boss prefer to hear?
5. Personally identifiable information
Personally Identifiable Information (or PII) is strictly forbidden to collect in Google Analytics.
Make sure to check your account for any PII since Google Analytics is allowed to terminate your account if any PII is collected.
It happens quite often that this information is submitted via search boxes and from fields. And it won’t be the first time that I see email addresses appearing in a Google Analytics account.
I recommend to read this article by Google as well:
Pay extra attention if you have User Id’s implemented. Violating the PII laws can easily be done in this case.
6. Bounce rate
You are doing great if your overall bounce rate is below 30%. However, if your bounce rate is below 20 or even 10% you need to be suspicious.
It could be that your tracking code is fired twice on your pages. Your website visitor cannot bounce when a second pageview is automatically triggered.
Three tools to help you debug your implementation:
Less often I come across extremely high bounce rates. This can be due to unfiltered spam or ghost traffic or an improper Google Analytics implementation. You might end up with a very high bounce rate if you haven’t tagged many of your pages.
Example of where high bounce rates might occur: The majority of the people that visit your website are clients. When they click on the “sign in” button, they are redirected to another environment (which is not tracked by Google Analytics). You have outbound link tracking enabled, but the link is measured as a non-interaction event. In this case your bounce rate might be very high because of these settings.
In order to prevent your bounce rate from becoming flawed, you need to tag all your website pages and make sure that your tracking code is only fired once on each page.
7. (Not set) values
Checking (not set) as a value for your key dimensions is another thing you should definitely check in your Google Analytics account.
The appearance of a high percentage of (not set) in a particular dimension almost always indicates a tracking issue.
Here are eight dimensions you should check:
- Landing Page (Behavior > Site Content > Landing Pages)
- Page Title (Behavior > Site Content > All Pages)
- Hostname (Audience > Technology > Network)
- Source and Medium (Acquisition > All Traffic > Source/Medium)
- Organic Keywords (Acquisition > Campaigns > Organic Keywords)
- Paid Keywords (Acquisition > Campaigns > Paid Keywords)
- Browser (Audience > Technology > Browser & OS)
- Geo Location (Audience > Geo > Location)
Read this in-depth article on (not set) by LunaMetrics and apply the tips to your Google Analytics account. Please note that there is one browser (Safari (in-app)) that always has a high percentage of (not set):
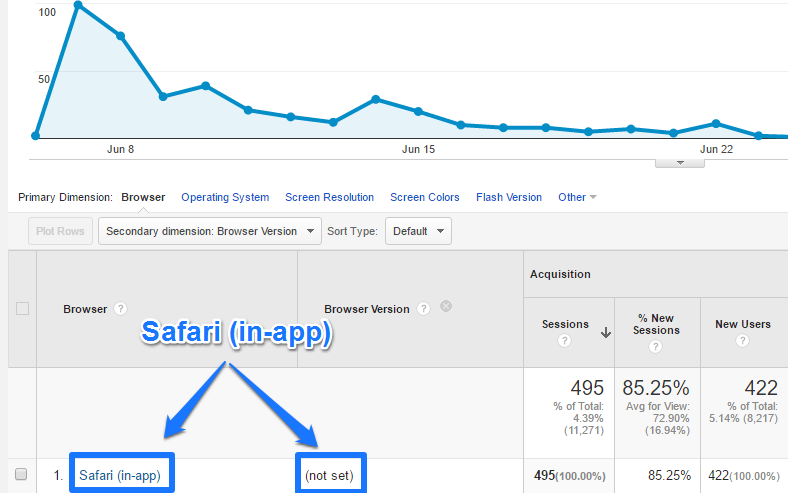
You don’t have to solve this one.
It is extremely helpful to automate these checks, especially if you are working for multiple companies as a digital analytics consultant. Supermetrics for Google Drive can eliminate many of these tasks for you and speed up your (not set) implementation check.
8. Content reports
How many “unique” URLs are visible in your “all pages” report? You might spot thousands of pages although you know your website counts far less unique pages. This is the case when there are a lot of query parameters present.
Here is a fictional example:
- supermetrics.com/tools/grab/?id=19204035035
- supermetrics.com/tools/grab/?id=19204035011
- supermetrics.com/tools/grab/?id=19204035025
The id at the end of the URL is the unique identifier. This will make Google Analytics register three different pages on default. In reality this is the same page with only one technical parameter present.
Here are the steps you need to take:
Step 1: sit down and investigate your content reports for an overview of these parameters. Make a list (in Excel).
Step 2: talk to your web developer and make sure that your list is complete.
Step 3: decide upon the parameters and make a list of non-essential parameters (parameters that don’t add any value to your analysis)
Step 4a: add the non-essential parameters to your view settings.
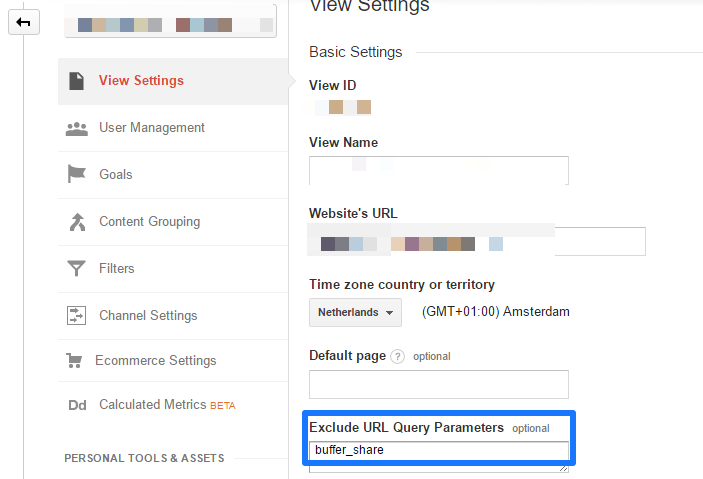
The following step is only recommended if you want to filter out all query parameters, both now and in the future.
Step 4b: add a custom filter to filter out all query parameters.
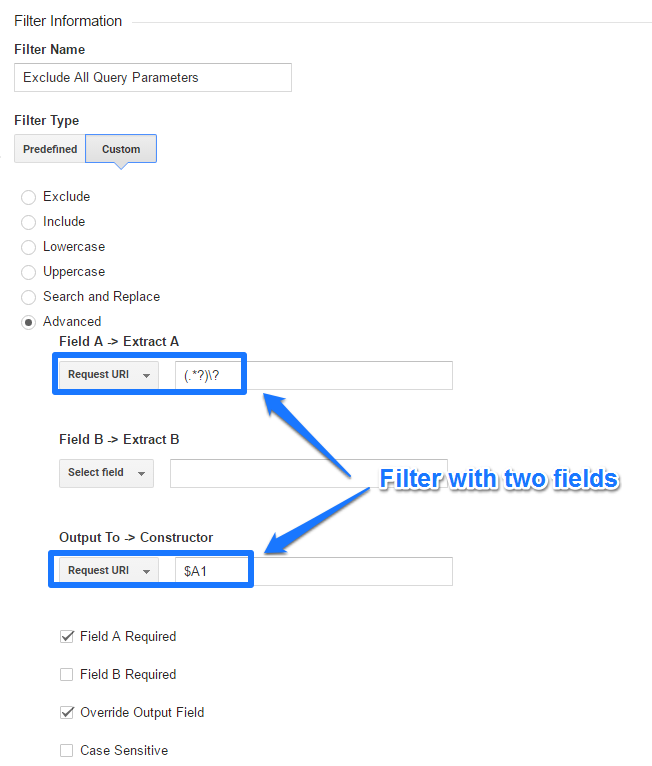
Filtering out non-essential query parameters will make your content reports much more accurate and actionable. You can choose to pursue step 4a or step 4b. For less experienced Google Analytics users I recommend to start with step 4a first.
9. Annotations
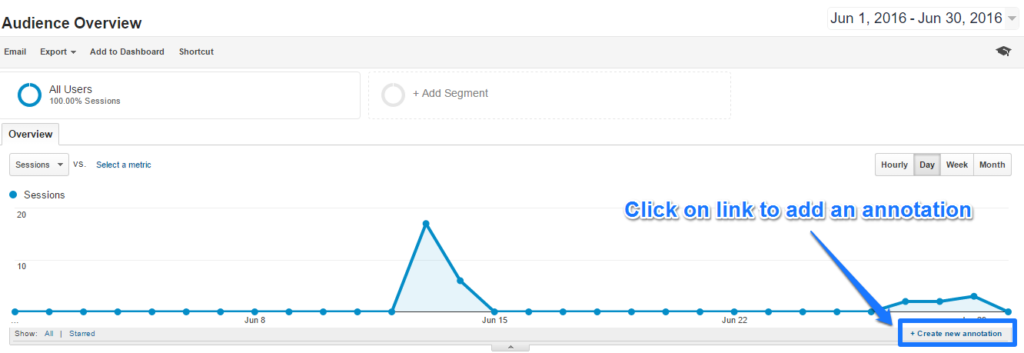
Do you keep track of your marketing campaigns, technical website changes and other changes that might have a big impact on your website numbers?
If not, you really miss out on providing context for your data analysis.
To make things easier for you, Google Analytics has a built-in feature called annotations. Here are five tips when using them:
- Be explicit about what it means (you have 160 characters for each annotation).
- Keep in mind the people that will be reading them in the future.
- Record both online as well as offline marketing campaigns.
- Record any updates (e.g. adding filters) and/or site issues.
- Record any external events that might have an impact on your traffic.
One last thing, don’t overdo. These annotations need to add value, so very minor changes should not be added to avoid confusion in your organization.
You can set them up in the reporting interface or via the admin interface.
Annotations via reporting interface
Annotations via admin interface
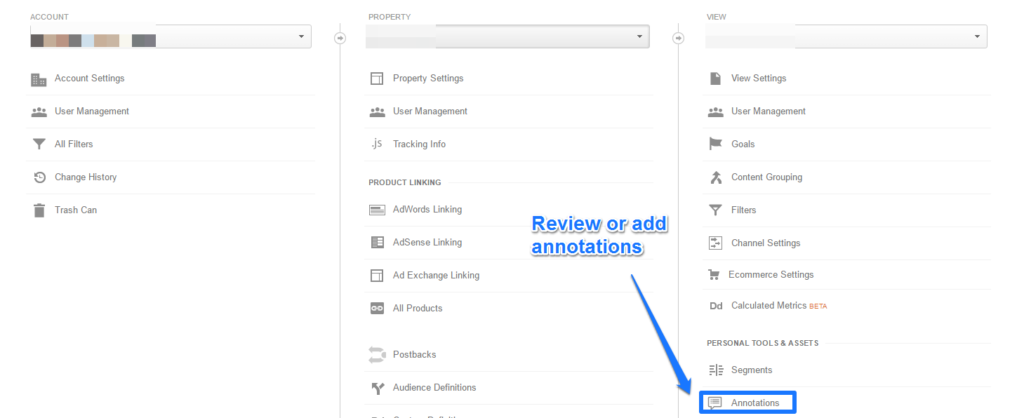
I prefer to set them up in the admin interface if I want to add multiple annotations at a time. Please also note that you can only set up future annotations via the admin interface.
Annotations are a great help in analyzing your data in context. I recommend to make them publicly available so that your team members can benefit from this information as well.
10. Traffic sources (source/medium)
Another crucial thing to get right is campaign tracking.
Head over to Acquisition > All Traffic > Source/Medium.
Does this report section look clean with sources and media that you understand and can relate to? Or is it a mess with not much saying names that make you confused?
In the first case, great! You belong to the minority of people that get this set up right. In the second case, you have some work to do!
Google Analytics allows you to structure all your campaigns and traffic sources in a meaningful way. Direct traffic, organic traffic, referral traffic and AdWords traffic (if AdWords is integrated with Google Analytics) is taken care of automatically, but the rest of your channels need special attention.
This extensive guide on campaign tracking is definitely worth checking out if you want to learn more.
Tracking your campaigns in the right way makes your all traffic sources report reliable and powerful. Once you understand the basics of how to set this up, it is highly recommended to use a spreadsheet to keep track of everything in a better way.
Concluding thoughts
When it comes to setting up Google Analytics in the right way, there are a lot of things to keep in mind. Start with checking and applying these 10 tips first and you will be well ahead of the pack.
The more attention you spend to this phase, the more reliable your data becomes and the higher are your chances that you can extract actionable insights from your data.
What are your main challenges with getting the Google Analytics setup right? Do you apply a particular strategy when setting up your Google Analytics account?
About Paul Koks

Paul Koks is an Analytics Advocate at Online Metrics and a guest writer for Supermetrics. He is a contributor to industry leading blogs including Kissmetrics, SEMRush, Web Analytics World and Online Behavior and the author of Google Analytics Health Check. Paul helps companies to capture valuable insights from simple data. You can find him on Twitter or LinkedIn.
Stay in the loop with our newsletter
Be the first to hear about product updates and marketing data tips
